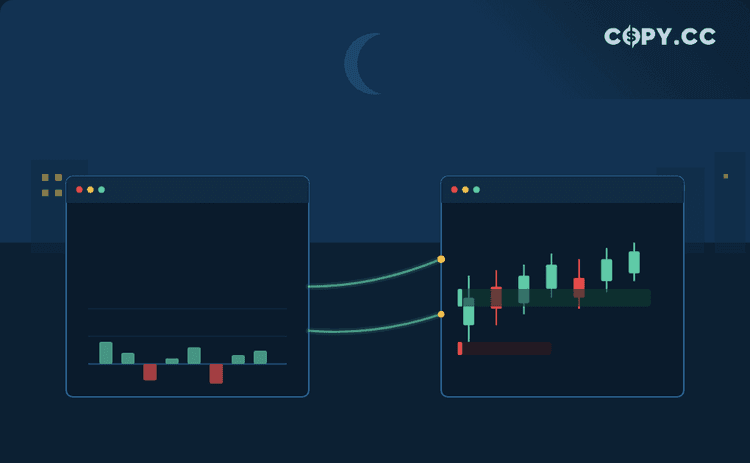
Two enhancements have been released in the futures trading zone on web and mobile. Traders can now access funding rate history for all instruments, and a position visualization layer has been added to the charts.
Funding Rate History
The funding rate is a periodic payment between long and short traders that keeps perpetual futures prices anchored to the underlying spot market. Historical funding rate data is now available for every trading instrument in the futures zone. This allows traders to review past funding payments, analyze patterns, and estimate the cost or income associated with holding positions over time. The data is accessible directly from the trading interface.
Position Visualization
A graphical overlay of open positions has been introduced on the charts. The visualization shows a trader’s active position alongside the price action, eliminating the need to toggle between separate order and chart windows. This makes it easier to monitor position performance and react to market moves without losing context.